
2025 Performance Review


It’s been two years since we started Reveles. We could not have asked for jobs more suited to our personalities and curiosities. The past two years have been fun and filled with learning. Every morning, arriving at the office, we look through our list of companies and dig through a stack of 10Ks with the excitement of treasure-hunters. It’s both rewarding and intellectually stimulating.
We have been using this “financial journal” (sounds more premium than “blog”) as a way of not only documenting but also of clarifying our ideas—even to ourselves. We find it helps improve our process.
But building a portfolio takes time. And after two years, we’re only at the beginning. We are roughly 33% invested, with the remainder held in cash. As Buffett has said, investing — much like choosing a life partner — rewards patience. So for now, we are staying patient.
Our aim is to eventually hold a portfolio of ten companies, each of roughly equal size. This keeps things simple, and simplicity is often preferable to complexity.
Below is a summary of our overall return and of our key positions. We will follow up soon with a post about the fundamentals of each company.
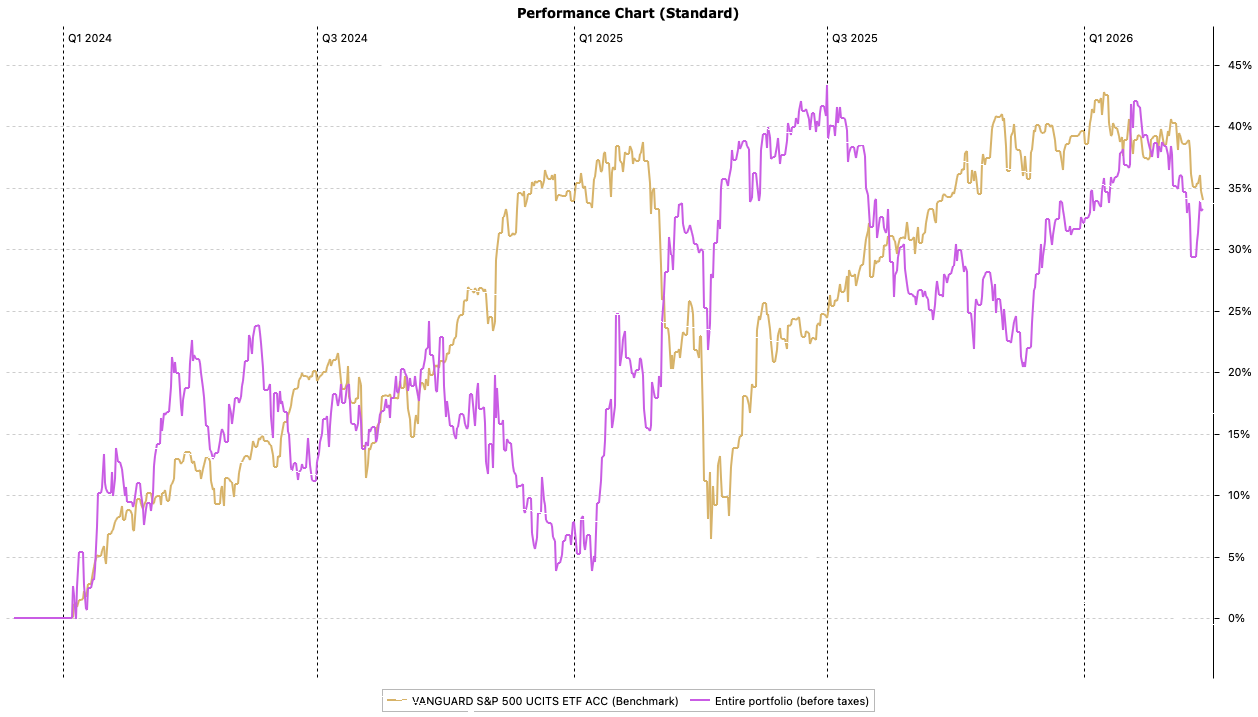
In the chart above, the green line is our benchmark which is an ETF of the S&P 500. Since Q1 2024, its total cumulative return has been 35%.
Why do we benchmark against the S&P500, if the majority of our assets are currently in Europe? The convention sometimes, for international portfolios, is to benchmark against a global index (an easier comparison).
This makes sense if the portfolio has a global mandate, because then the managers are more constricted in their choice. They have to invest internationally, so performance should to be judged against an international standard.
But if managers are not thus constrained, why should a benchmark reflect where the assets happen to be located? It should judge the choices that were made—i.e. where the manager chose to allocate capital. It should reflect the opportunity cost of that capital.
The S&P 500 has historically been the safest, most liquid index. Therefore we consider it our most relevant hurdle rate.
As of March 27th, our performance over the same time span has been 34% — just shy of the benchmark. We are frankly disappointed with this return, as we aim to do better than the market.
Our performance is measured in dollars, using the True Time-Weighted Rate of Return as calculated by the Portfolio Performance software. TTWROR is standard for measuring whole portfolio performance. It’s a total return — realized gains, unrealized gains, dividends, and changes in FX. It does not include fees & taxes.
One notable observation is the inverse correlation of our portfolio to the benchmark. We have been up when the market was down and vice-versa. This is to be expected given our focus on value.
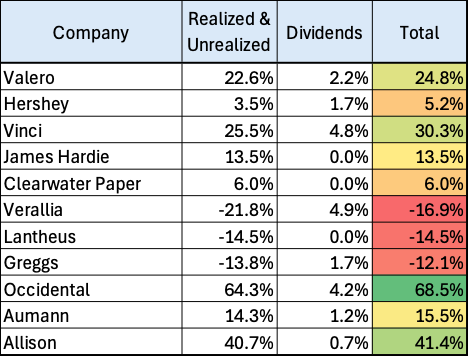
To better understand the drivers of overall portfolio performance, the returns of the individual holdings are shown below using a simple money-weighted return calculation.1
We calculate this as gains (realized, unrealized, dividends) over cost basis.
We hedged part of our euro and sterling exposure during the holding period using futures contracts, and this proved quite profitable. However, because this was a portfolio-level decision rather than one specific to individual holdings, we have excluded it from the figures below.
Holding periods differ for all securities, and do not affect this return calculation.
In the next post we’ll discuss the fundamentals of our current portfolio holdings.
All materials produced by Reveles Research, LLC—whether posted on this site or distributed elsewhere—are supplied solely for information and education. Nothing herein constitutes, or should be construed as, investment, legal, or other professional advice. You should carry out your own analysis and due diligence before acting. Every investment decision ought to reflect your unique financial circumstances, objectives, and tolerance for risk.

TTWROR makes sense for the whole portfolio because it is trying to answer a simple question: how well did the portfolio perform, apart from the timing of deposits and withdrawals? If you add cash in one month and withdraw cash in another, those flows can distort the picture. TTWROR strips that out and focuses on the return generated by the investments themselves. That makes it a good measure of how well the portfolio was managed over time.
For individual stocks, a money-weighted return often makes more sense because it reflects your actual experience as an investor. With a single holding, the timing of your buys and sells matters a lot. If you bought more shares after a big rise, or added most of your money near the top, that changes the result you actually earned. A money-weighted return captures that reality. It tells you not just how the stock performed while you owned it, but how your dollars performed based on when you put them in.