Vinci S.A.
Veni, Vidi... VINCI!


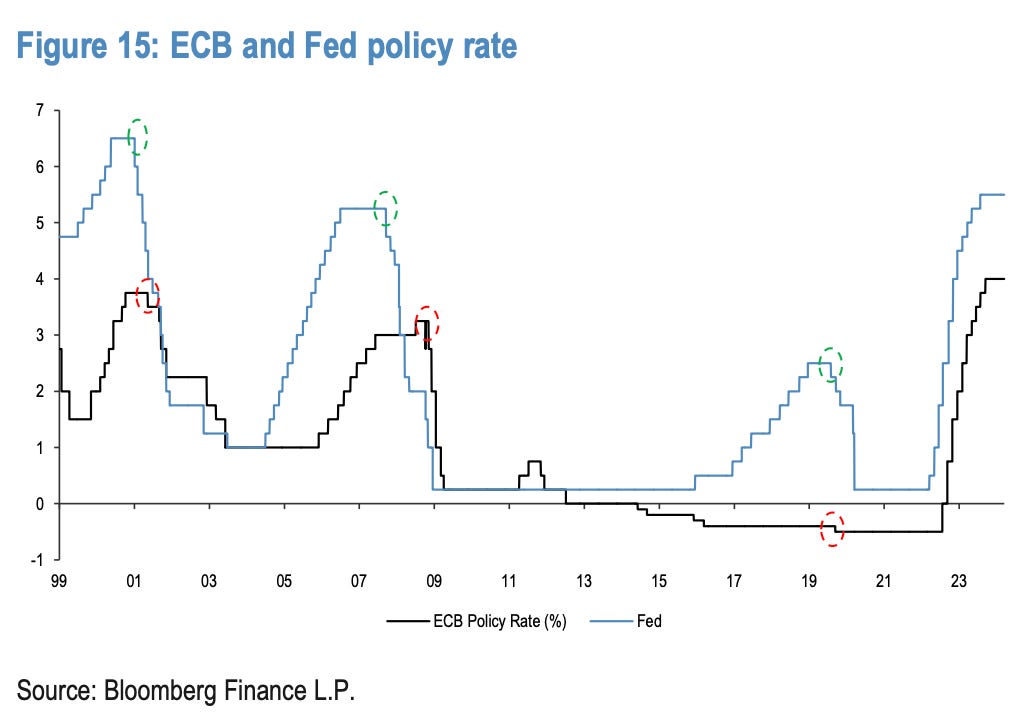
While the US economy has consistently defied widespread expectations of a hard landing, the situation in Europe has been different, where since early 2023 real GDP growth has underperformed (see chart below). All else equal, this gives the ECB more reason, perhaps some urgency even, than the Fed to cut rates in the coming months.

In the US, inflationary pressures have been mainly showing up in the shelter component of CPI, which is being driven by a surge in immigrant demand for housing (immigrants who are also, on the other hand, expanding the pool of low-skilled labor and putting downward pressure on wage growth).
In the Eurozone things are somewhat different: there, it is wage growth that’s proven stickier and pushed up prices in the labour-intensive services sector. However, there is reason to believe that the weaker macro-economic environment in Europe will soon begin to erode workers’ bargaining power. Much of the jump in wage growth was driven by workers attempting to make up for lost purchasing power due to the energy crisis after the invasion of Ukraine, which is now being less frequently cited in collective wage bargaining negotiations.

Though the ECB tends to lag the Fed in cutting and hiking rates by a few months, there is a chance that the Governing Council members decide to move ahead this time around, given the macro divergence between both economies. Should this happen, there could be a shift in allocation to cheaper European equities.
With this thesis in mind, we screened for companies in Europe with a potential to benefit from an easing cycle, poised to gain not only from a lower cost of capital and discount rate, but also from stimulated demand.
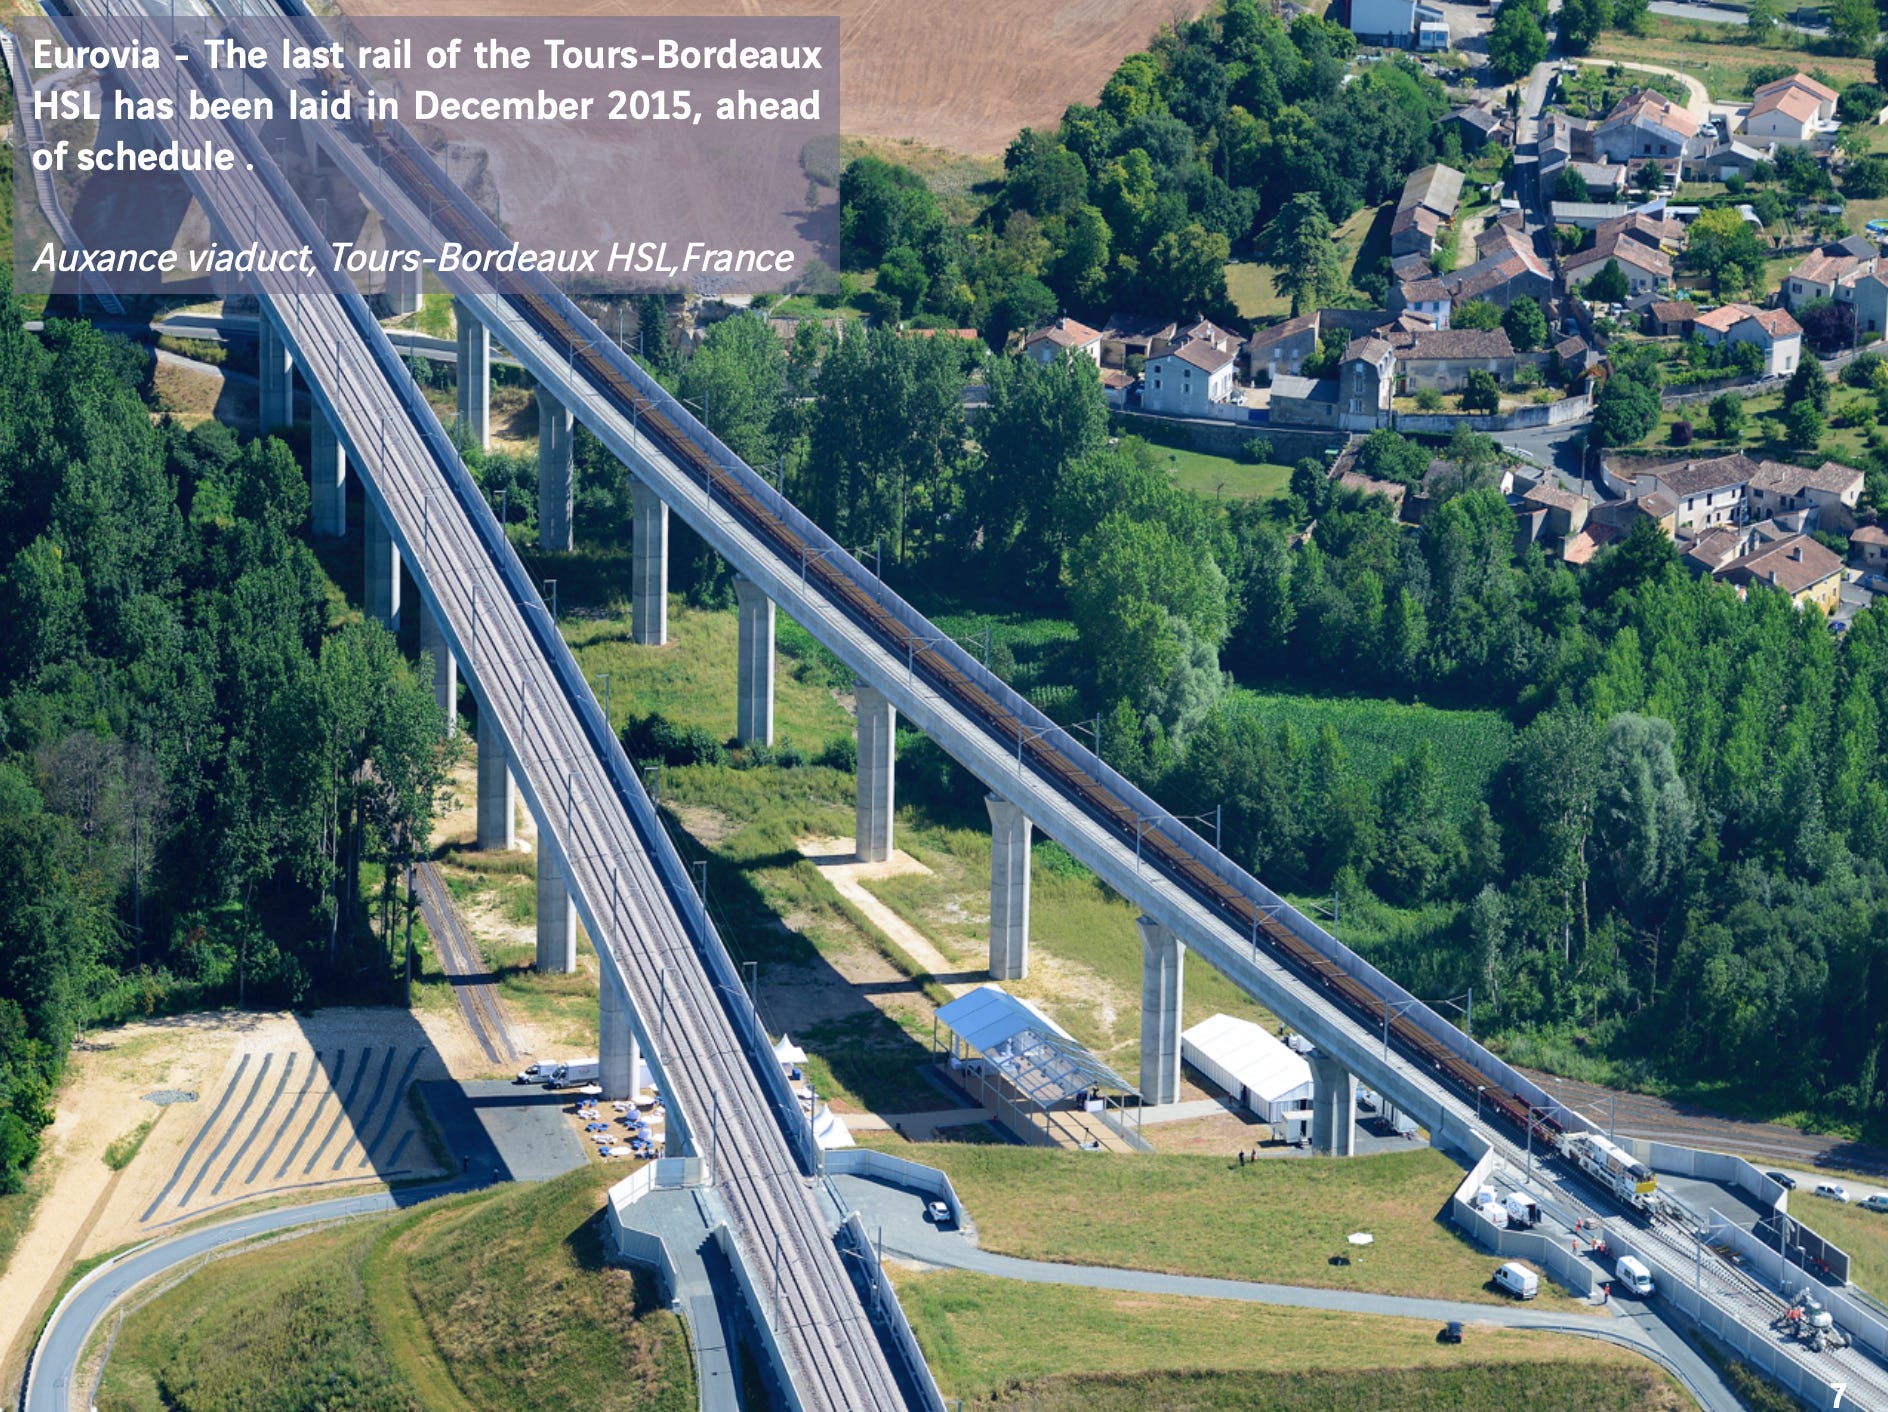
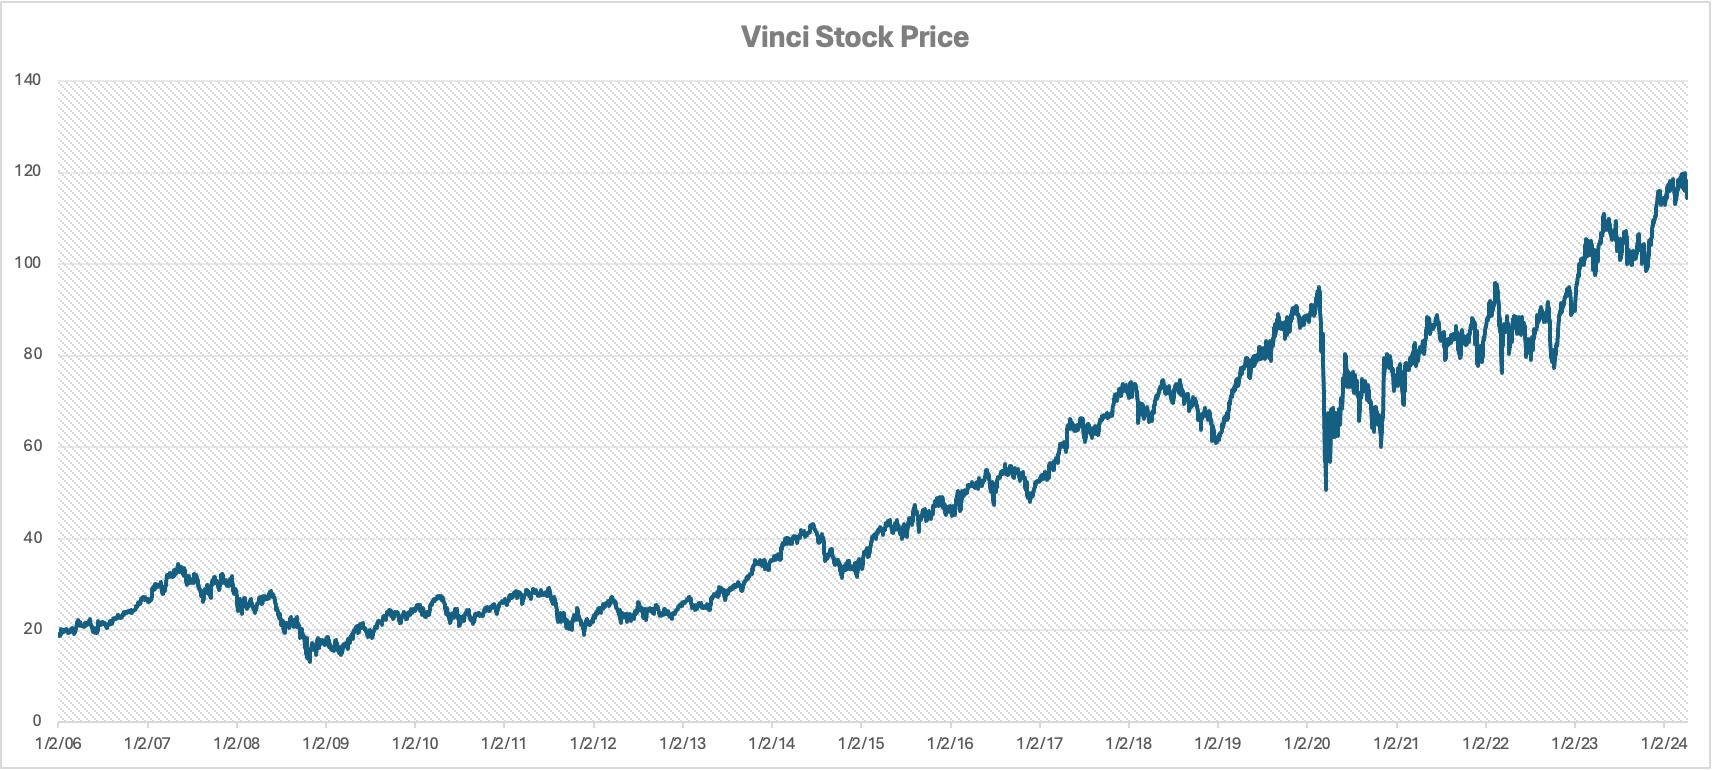
Vinci S.A. could be one such company, being a construction and infrastructure concession operator based in France. It is a large, mature business, with a market cap of $73bn and 220k employees spread out over 120 countries. It has a long-term, high-quality asset base that is largely insulated from disruption risks, has strong and stable free cash flow, and would perform disproportionately well in a lower interest rate environment. It also pays a nice, stable dividend of 4%.
Broadly speaking, the company's operations span a diversity of businesses which focus on executing EPC (Engineering, Procurement, and Construction) contracts relating to energy and transport infrastructure. Essentially Vinci builds and maintains bridges, subways, highways, solar farms, high-voltage power lines, re-gasification terminals to take in liquified natural gas, etc, etc…

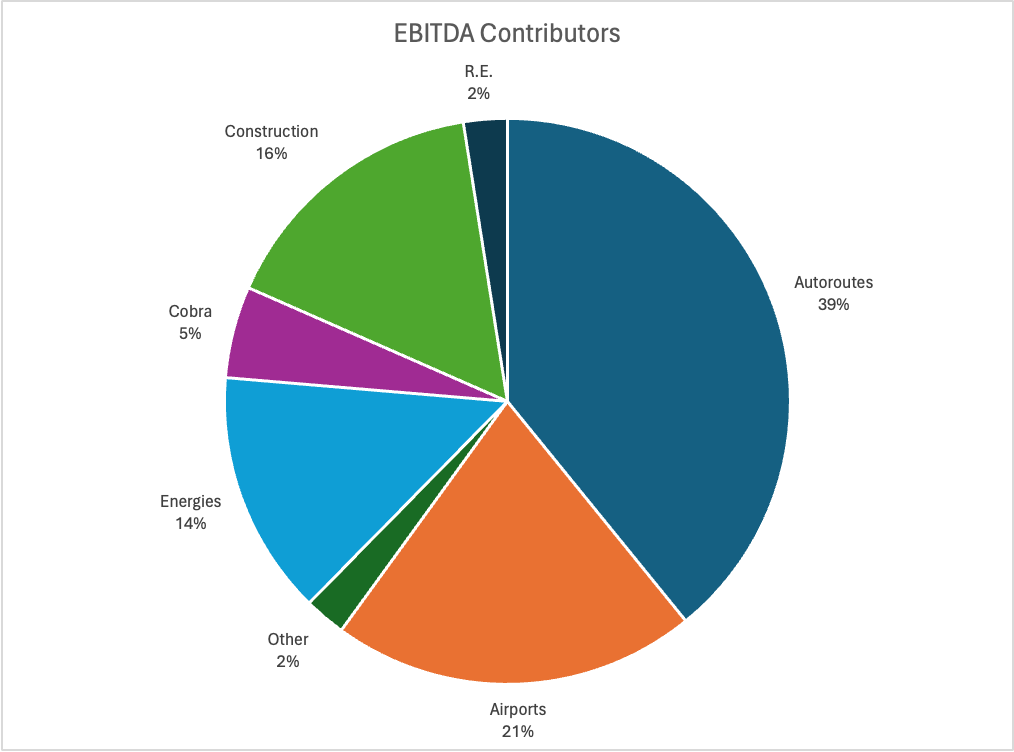
But for all its various businesses there is really only one main narrative to consider when talking about Vinci—its ownership of concession rights to operate toll roads in France and airports globally, which stand out as jewels in its crown.
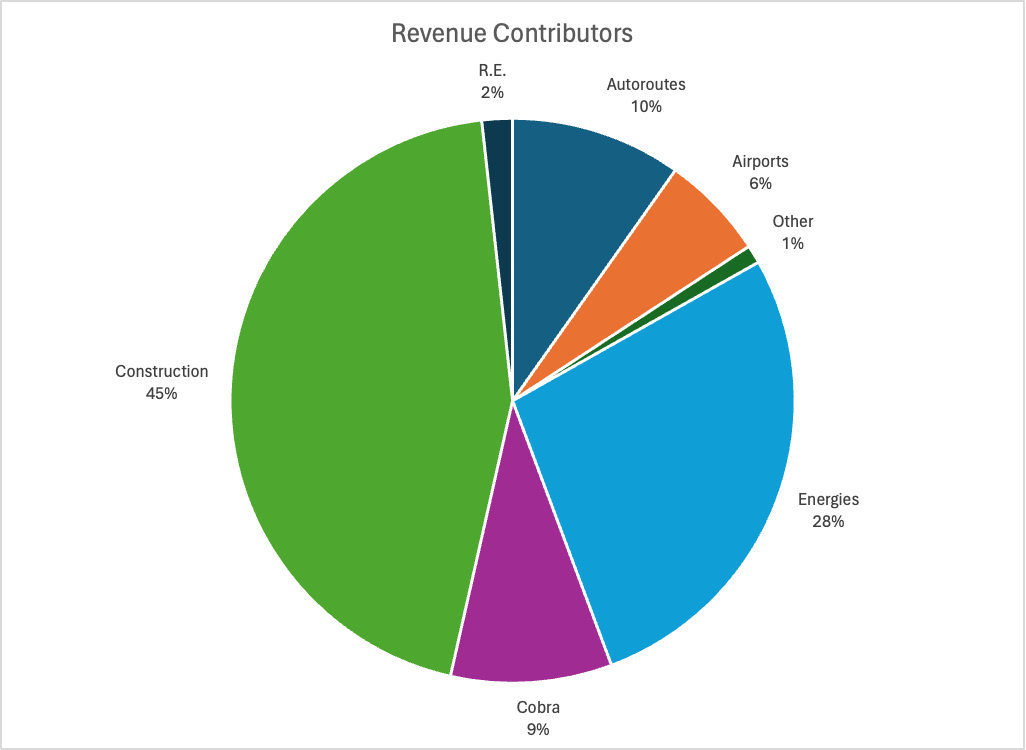
Below are two charts showing a segmented Revenue and EBITDA contributors in FY2023. As we can see, the Autoroutes and Airports divisions made up 16% of total revenues but a whopping 60% of total EBITDA.
Vinci, the concessionaire
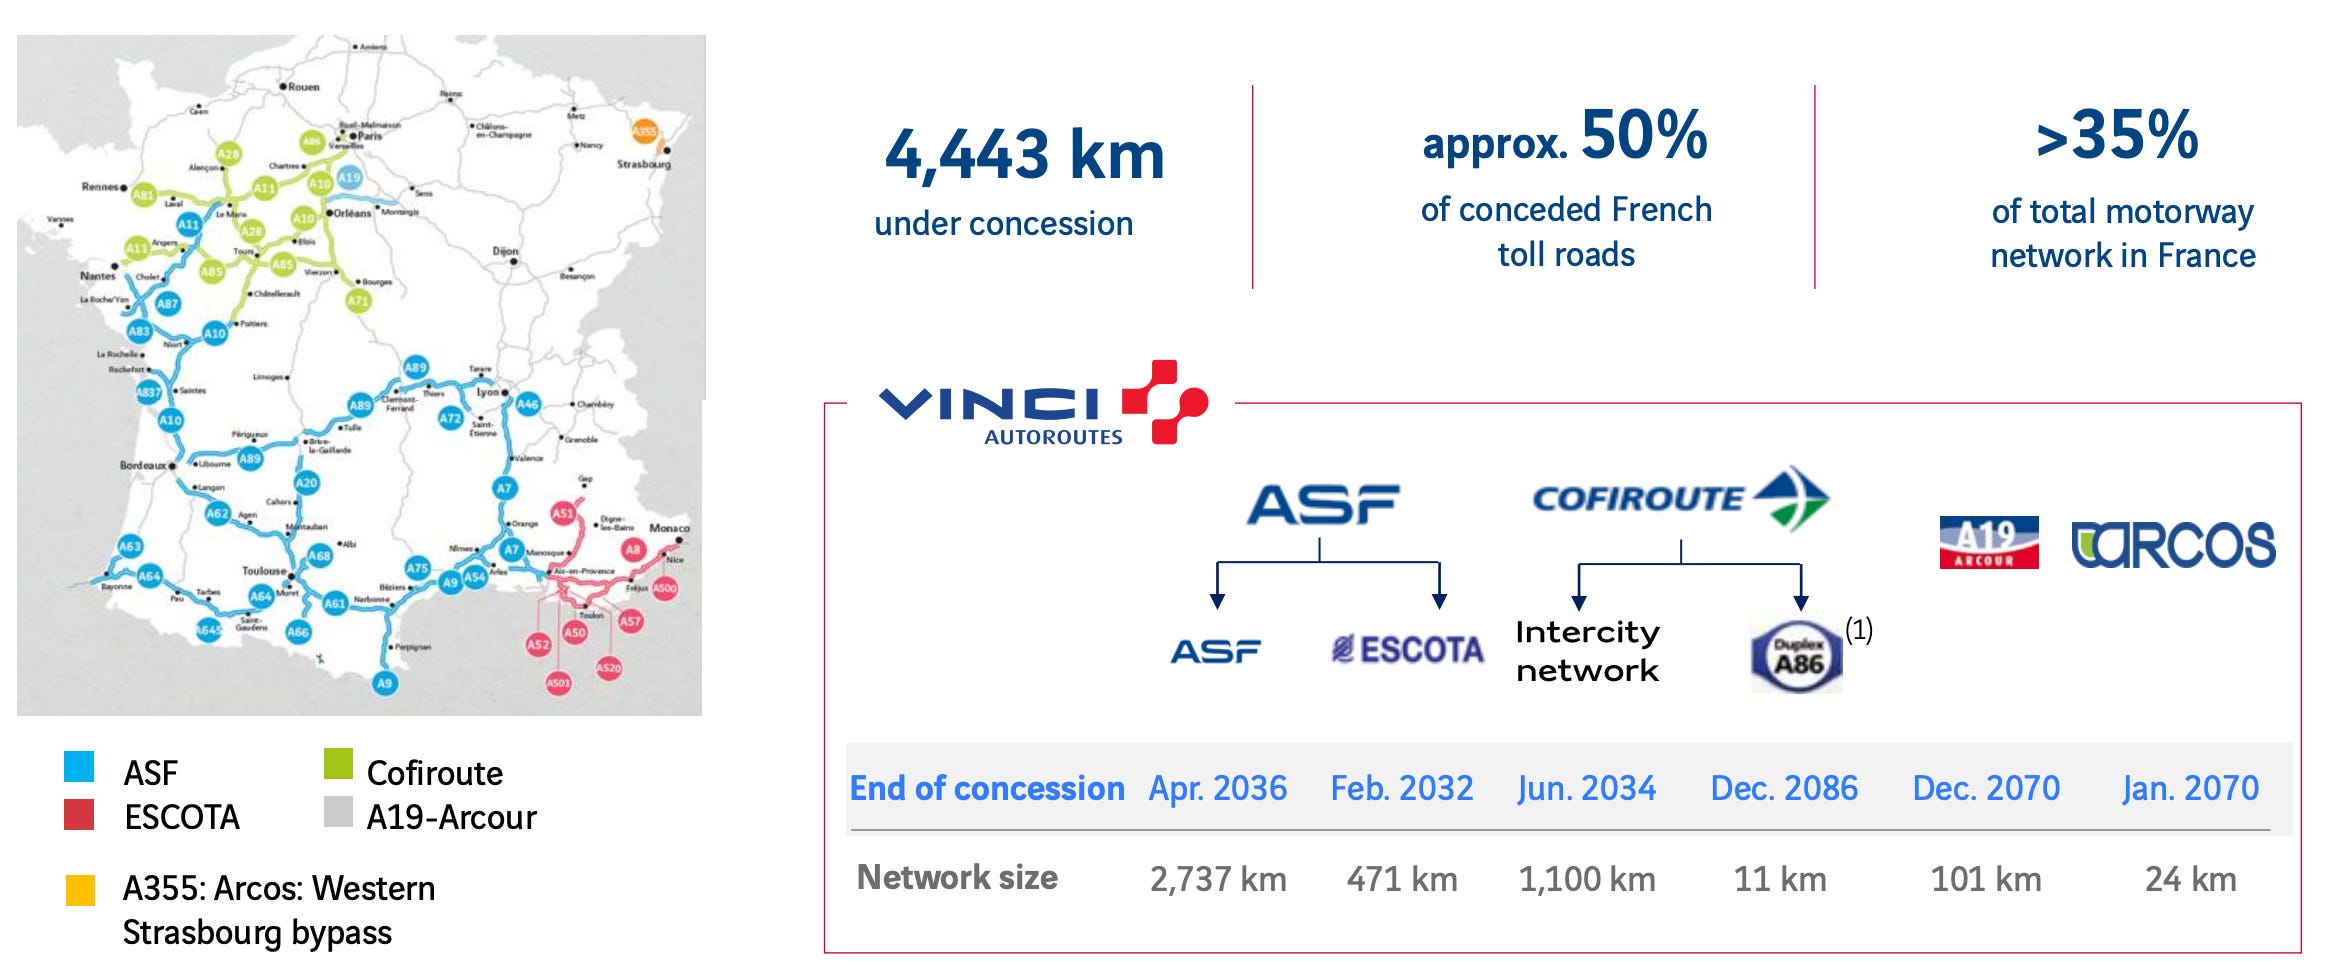
The story of Vinci in the 21st century begins with another company, Autoroutes du Sud de la France SA (ASF), a semi-public entity which by the early 2000s was France’s largest toll road operator, and second largest in Europe after Italy’s Autostrade. Vinci, already an owner of roadway holdings in France and elsewhere in the world, saw a merger with ASF as a complement to its own assets and bought it in 2005.
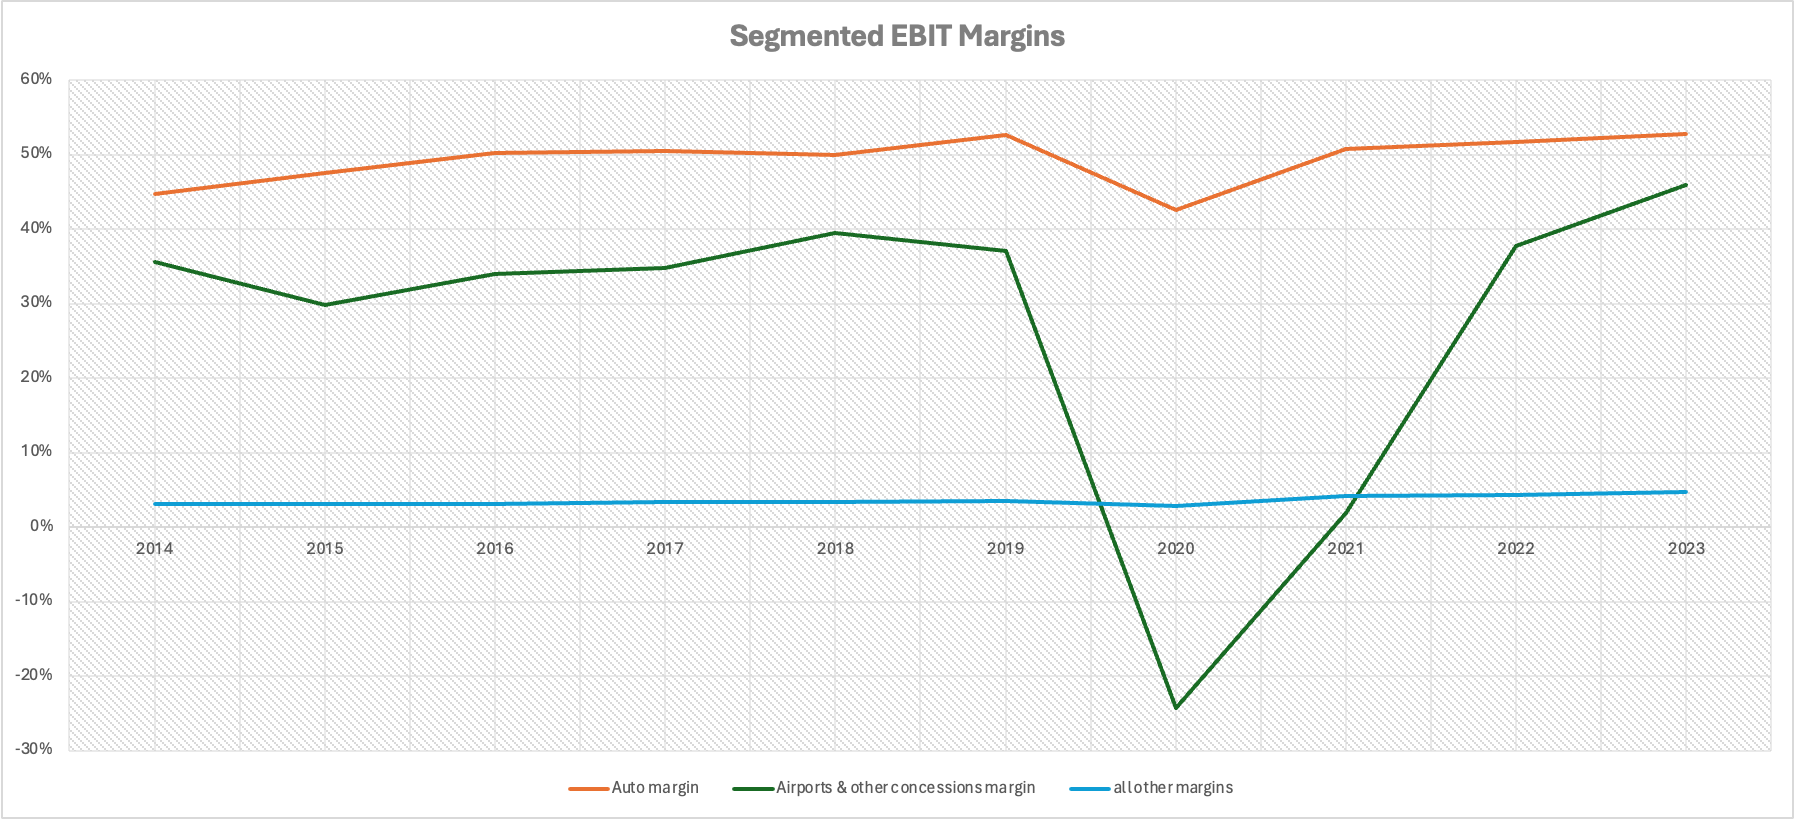
Since then, the Autoroutes division has been a huge cash cow, with a very high and growing EBIT margin of ~50%. What’s more, price adjustments are pegged at 70% of France’s CPI, so there’s also some baked-in inflation protection. Theoretically, the remaining 30% of CPI-related costs should be offset by volume increases—i.e. traffic growth—which indeed has, in actuality, kept pace and even sometimes exceeded France’s real GDP growth.
All in all, revenues in Autoroutes have been growing at an average of 3% for the last 10 years, whereas France’s nominal GDP has grown at an average of 2.8%. This is a stable, predictable monopoly that is very clearly tied to France’s economy.
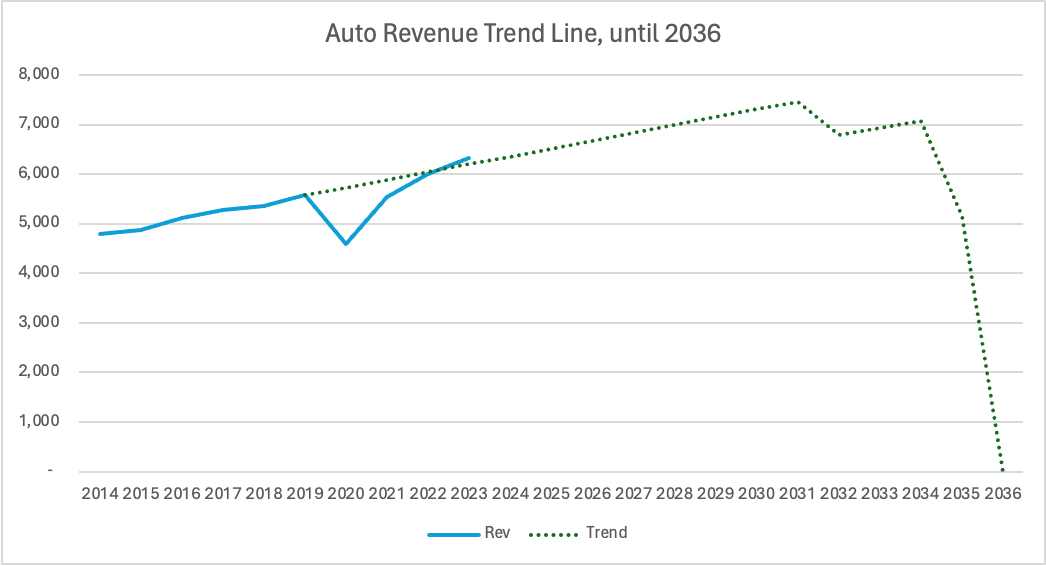
But all good things must eventually come to an end: the toll road concessions are mostly set to expire between 2032 and 2036. Consequently, for Vinci, capital allocation over the next few years will be critical, as management’s skill in prudently replacing that source of free cash flow will be tested.
For that, we can look no further than the Airports division, which in 2013 began to aggressively expand its footprint with the acquisition of ANA Aeroportos de Portugal, adding a 50-year concession contract for 10 airports, including in Lisbon and Porto, to its portfolio.
Today, ANA serves 66 million passengers per year (mpax) — 12% above its 2019 pre-covid traffic.
In 2015, Vinci bought a 40% stake in Kansai and Osaka International Airports — today at 42 mpax, still 20% below 2019 traffic.
Also in 2015, it won a contract to manage 40% of Santiago Airport — today at 23 mpax, down 5% from 2019 levels.
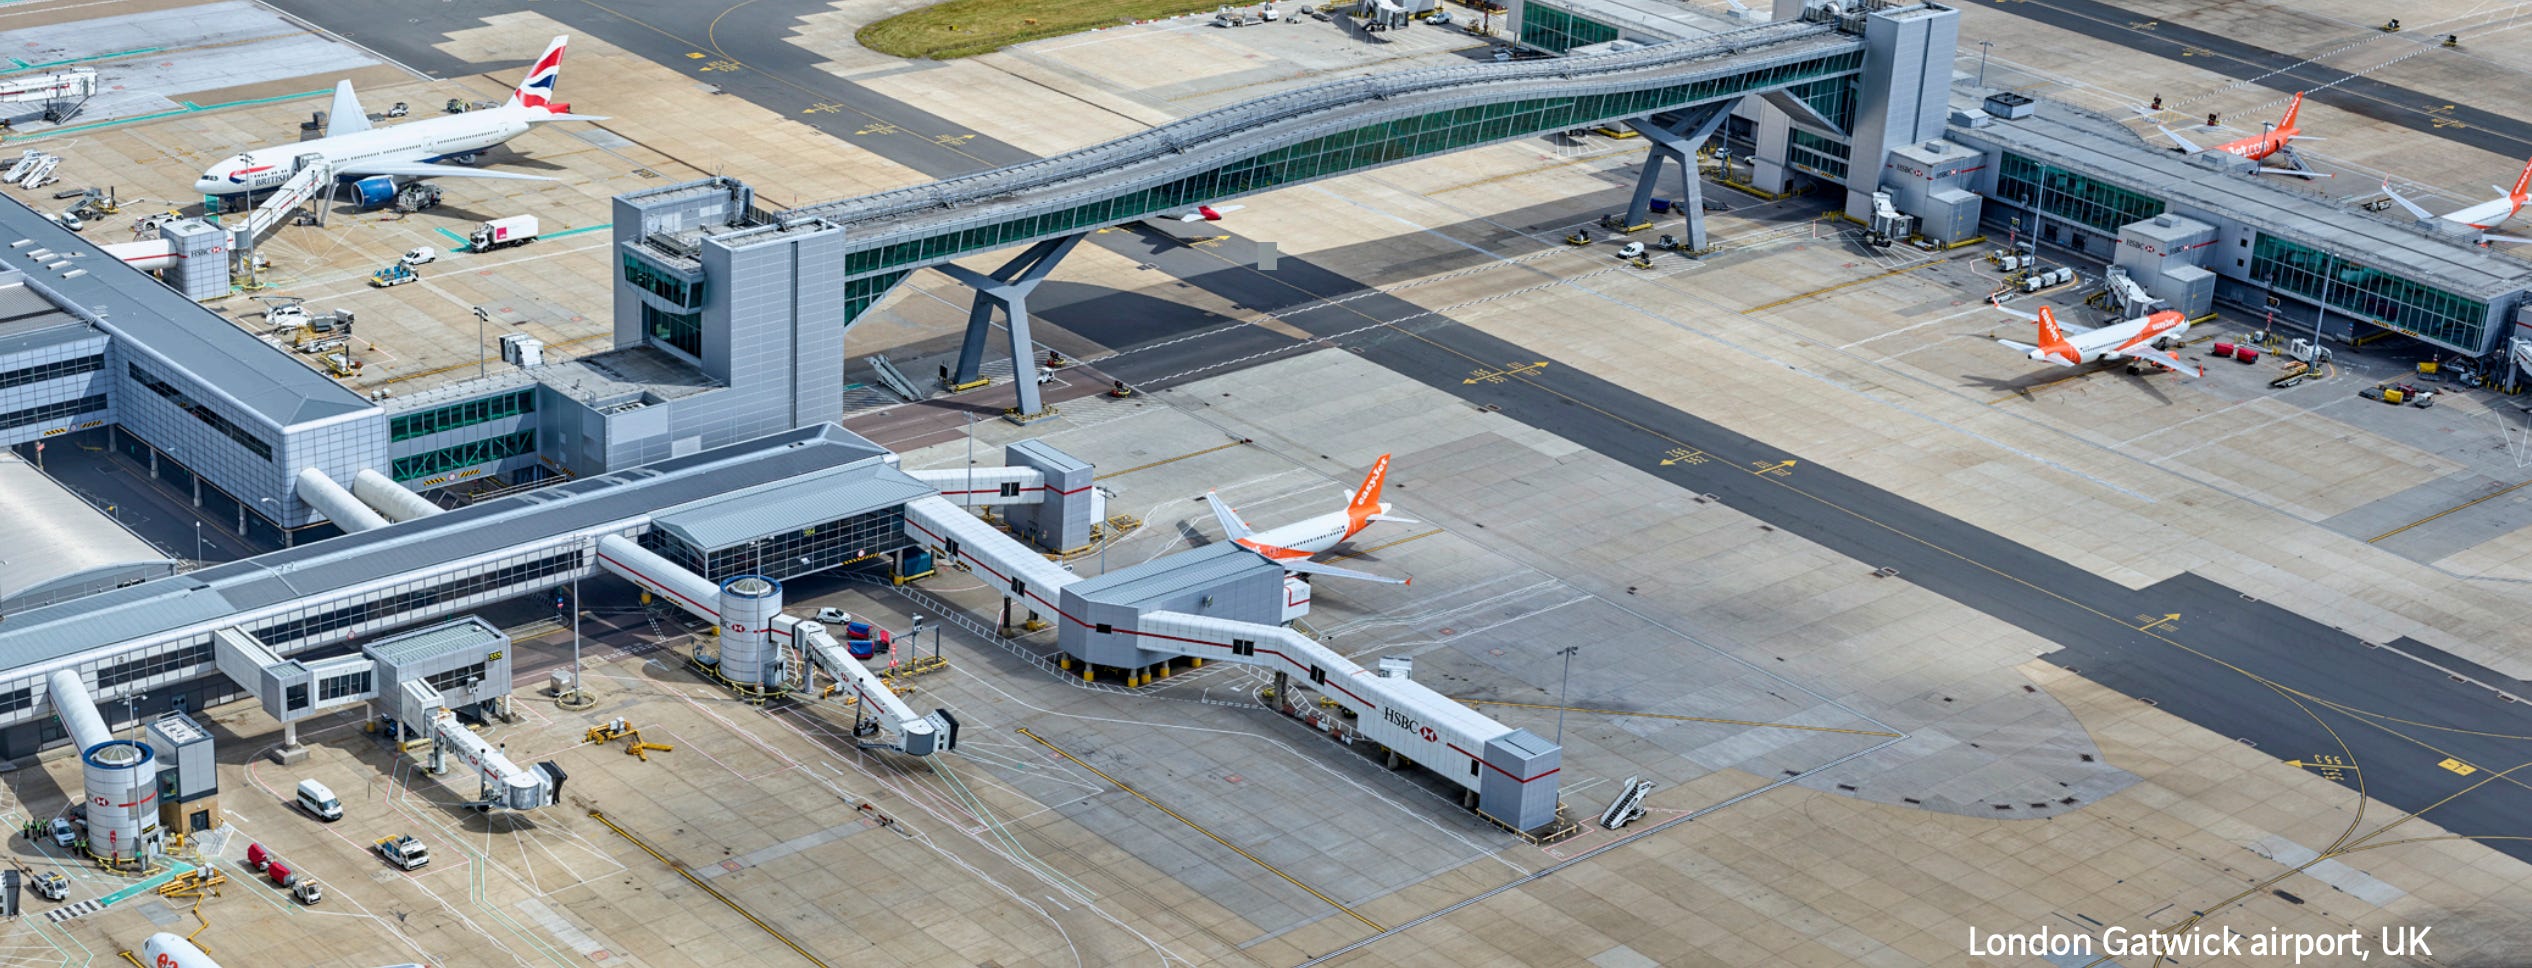
In 2018, it bought a 50% stake in Gatwick — today at 41 mpax, down 12% from 2019 levels.
In 2022, it acquired 30% of OMA, operator of 13 airports in Mexico — today at 27 mpax, 16% above 2019 traffic.
Though traffic levels are above pre-Covid levels overall, there is plenty of room for catch-up among some Asian and UK assets, which could provide a tailwind in 2024 for passenger growth. And EBIT margins in Airports is almost as high as in Autoroutes, at 46%.
Meanwhile, measures of profitability have remained high. Firstly, we compare Return on Equity to Earnings Yield (which can also be thought of as the Return on Market Value of Equity—what the market is willing to pay for those returns).
ROE = Net Income (to the Company) / BV of Total Equity
Earnings Yield = Net Income (to the Company) / Market Cap
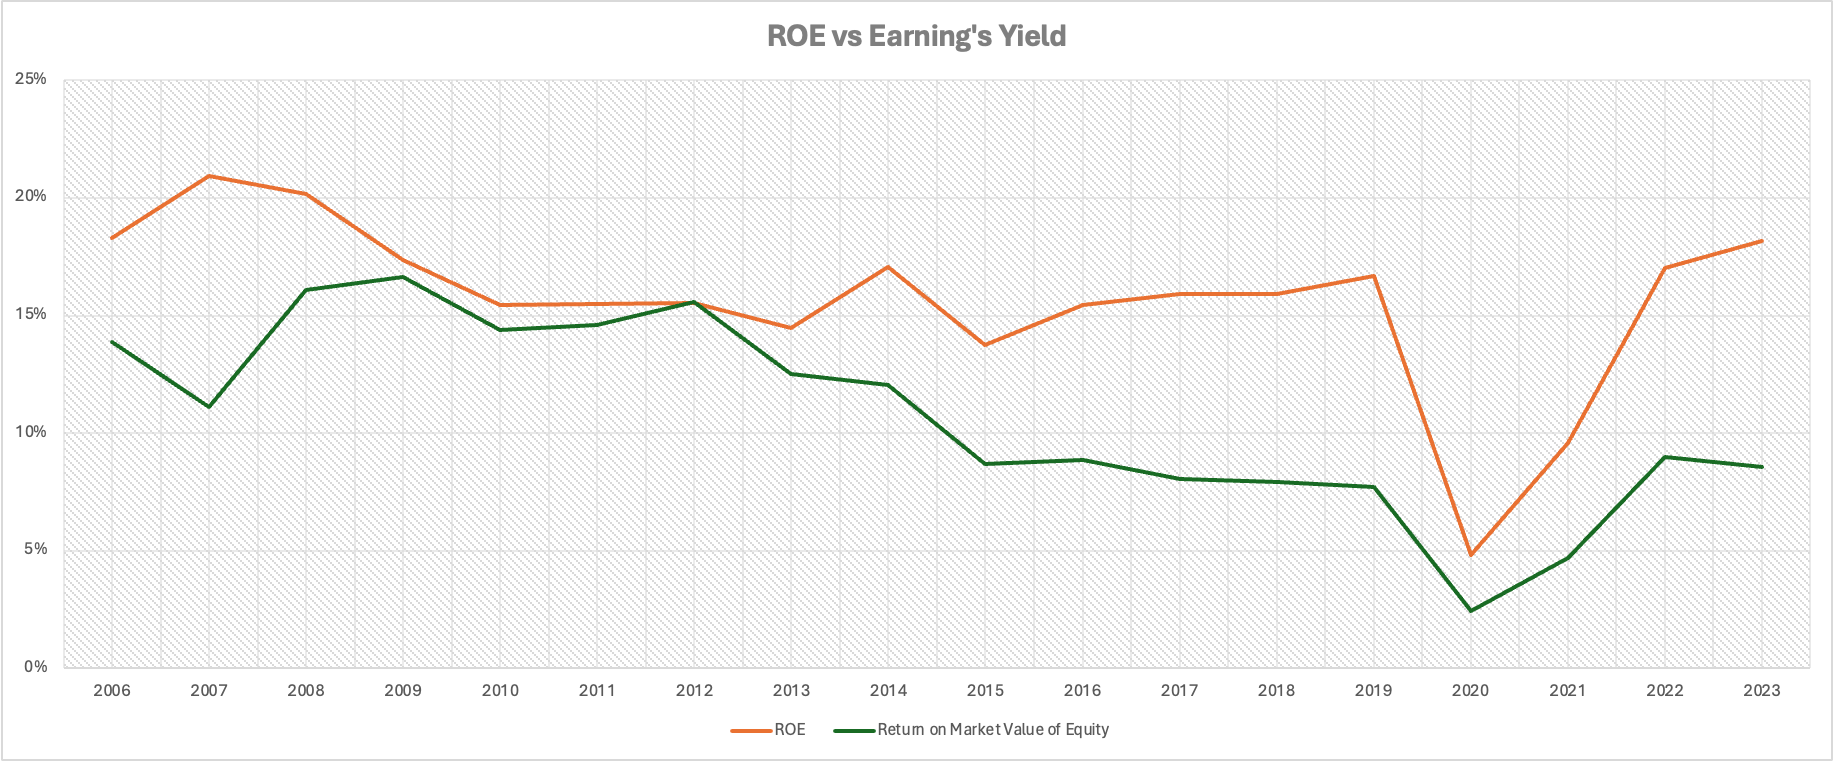
Looking at the decrease in Earnings Yield (since around 2013) alongside a fairly stable ROE, perhaps we can conclude that as Airports has grown into a larger part of Vinci’s business, the market has become more confident in Vinci’s ability to allocate capital, and is willing to pay more for earnings. Vinci’s stock price took off around 2013.
However, there are shortcomings to using ROE, especially in the case of Vinci.
Increases in debt or share buybacks can artificially boost ROE.
Write-downs are recognized as losses on the income statement, which directly reduce net income, while also reducing assets on the balance sheet, which lower shareholders' equity. Initially the impact on income (numerator) should be more pronounced and lead to lower ROE, while in the long-run it will boost ROE, since there are now fewer assets earning the same income. The effect is that it muddies the picture, since this is precisely our main concern as investors: to understand how accurately management can assess the potential value of extremely long-term assets like concessions when bidding on them.
Alternative Measures
So, we turn to measures of Return on Invested Capital, which neutralizes the influence of capital structure on the company’s performance by including debt in the denominator.
And, unlike in the case of ROE, the effects of buybacks on Invested Capital are also eliminated, contrary to popular opinion. This is because the source of capital for buybacks must come either from cash or additional debt. In both cases, Invested Capital remains unchanged.
Book Value of Invested Capital = Equity + Debt - Cash
If using cash to buy back stock, the reduction in equity will be exactly matched by the reduction in cash (lower equity - lower cash). If using debt, the reduction in equity will be matched by the increase in debt (lower equity + higher debt).
Now, what metric should we use in the numerator? Since any increase in assets, and therefore BV of Invested Capital, can be thought of as the cost of reinvestment, the cost of the use of those assets should also be included in the numerator—i.e. we should not use EBITDA, which excludes D&A expenses.
Using NOPAT seems more appropriate since ROIC, unlike ROE, is designed to measure the efficiency of a company’s core operations independent of its financing structure. NOPAT is the operating income available to all investors, adjusted for unusual items like write-offs.
Here are the charts of NOPAT / BV of Invested Capital, and NOPAT / EV:
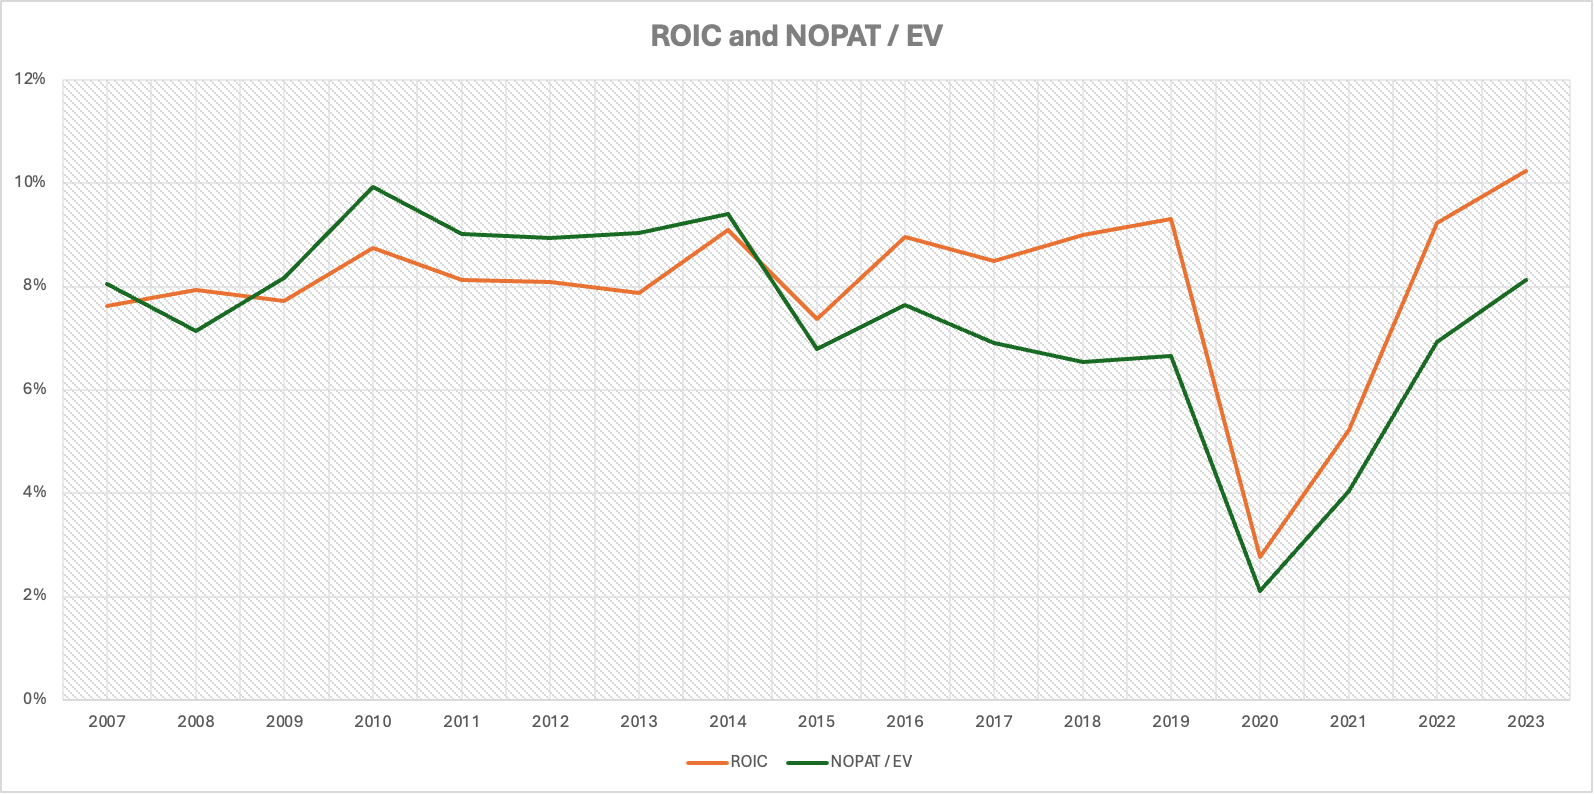
Interestingly, since 2013 we see a similar divergence as we did with ROE and Earnings Yield, but in this case NOPAT / EV has more recently trended higher (i.e. has a cheaper valuation, which currently sits at a 10-year low).
We can repeat the same exercise with Cash Return on Invested Capital.
CROIC = FCFF / BV of Invested Capital
Unlevered FCF Yield = FCFF / EV
I used a fairly conservative calculation for Free Cash Flow to the Firm. This included adding back both maintenance and growth Capex, cash spent on acquisitions, proceeds from the sale of PPE, and divestitures—essentially covering most components of CFI.
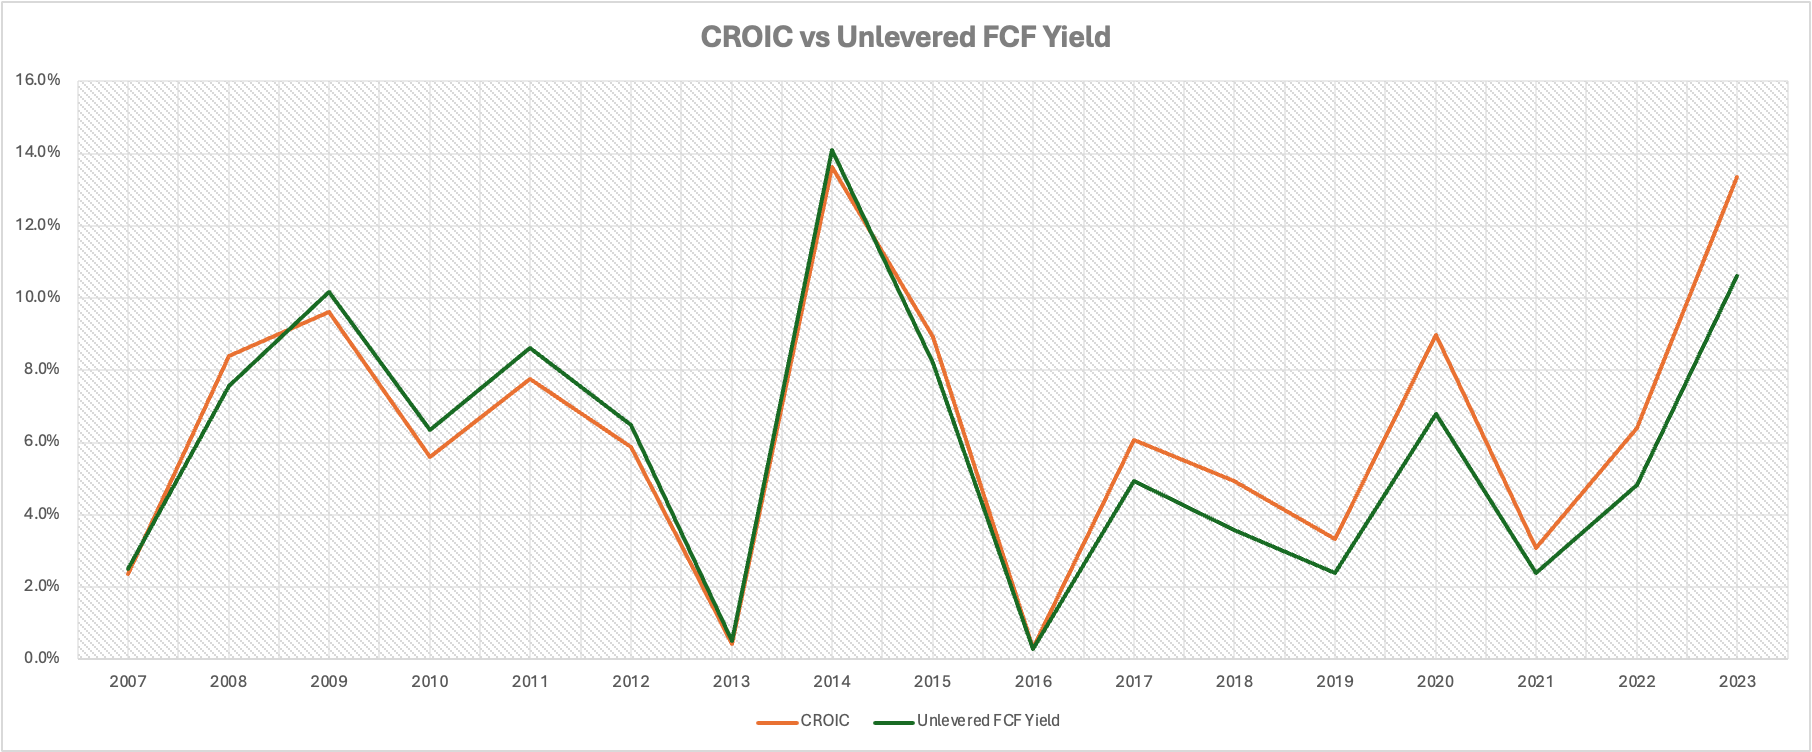
Here, the picture is somewhat different—there has been no discernible divergence in how the market values cash flows. Perhaps this confirms our thesis that valuation has changed because of investor confidence in management’s ability to allocate cash for future growth, and not necessarily on a current cash flow basis.
All this makes intuitive sense, since the nature of Vinci's business involves long-term contracts that provide a clear earnings stream, making it easier to forecast and value based on earnings rather than cash flows, which are volatile given that it’s a capital-intensive company. Nevertheless, an increasing cash flow yield is not exactly a bad thing.
DCF Inputs and Outputs
For our DCF analysis we split Vinci into three and valued the whole based on a sum of its parts: Autoroutes, Airports & Other Concessions, and All the Rest (Construction, Energy, Cobra, Real Estate).
Autoroutes was the most straight-forward.
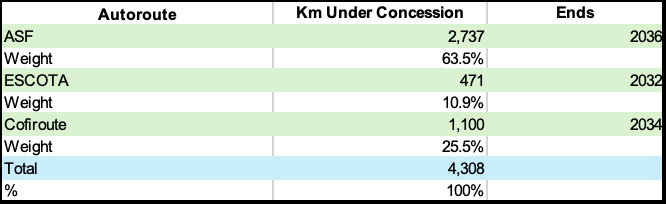
We used a trend-line to estimate total future growth, then reduced each weighted contribution on the year of expiration. Operating margin was estimated at 49%, which is the 10 year average.
For Airports & Other Concessions, we used the average revenue CAGR from 2015 - 2023 of 6%. Operating margin was estimated at 36%, which is the pre-Covid average (as expected, margins suffered during Covid but have since recovered).
For the rest, we used the average revenue CAGR from 2015 - 2023 of 1%. Operating margin was estimated at 4%, which is the 10 year average.
From there we weighted each EBIT margin and applied it to the total revenue. For reinvestment calculations, we took the Sales-to-Capital Ratio of 1.13, which is the 10 year average. This results in about 10% ROIC over the next 12 years, which is in line with the past.
Bottom-up beta for the engineering / construction industry in Europe is 0.64. Levering this up to account for Vinci’s debt / equity ratio gives us 0.93, which is in-line with CapIQ’s estimate of Vinci’s levered beta at 0.9.
Cost of Equity, which included an estimate for Equity Risk Premium and Country Premium (for France) was 8.51%. Total Cost of Capital was 6.35%.
This resulted in an estimate value / share of $106. Current price is $111.
Final Thoughts
On a macro level, Vinci has a lot going for it. As mentioned earlier, a declining rate environment generally acts as a positive driver for capital-intensive industries, as the reduction in capital costs lowers the expenses associated with financing large-scale projects.
On the consumer side, the disparity between European and US rates might keep the dollar strong relative to the Euro, making Europe a more attractive travel destination for American tourists. And any recovery of air traffic in Asia and the UK to pre-Covid levels would further boost profitability.
Vinci is also positioned to capitalize on secular trends within the construction and energy sectors: namely, electrification and near-shoring, both of which will require vast amounts of new spending on infrastructure. Given the global context of very high public debt, governments will be loath to add this new spending to their books, which might lead to greater reliance on Public-Private Partnerships (PPPs) with companies like Vinci.
All in all, Vinci seems to be a fairly valued business, with good management and predictable revenue streams. Near-term upside is probably limited, but over time this could be a great compounder.
The content provided by Quits & Starts, including all materials on this website, in the newsletter, and in any other communication from its author, is strictly for informational and educational purposes. It is not intended to be, and should not be interpreted as, investment, legal, or any other type of advice. Readers are encouraged to conduct their own research and due diligence. It's important to remember that investment decisions should be tailored to an individual's specific financial situation, goals, and risk tolerance.