
Good Lookin', So Refined
2/2 Report on energy


The Business of Refineries
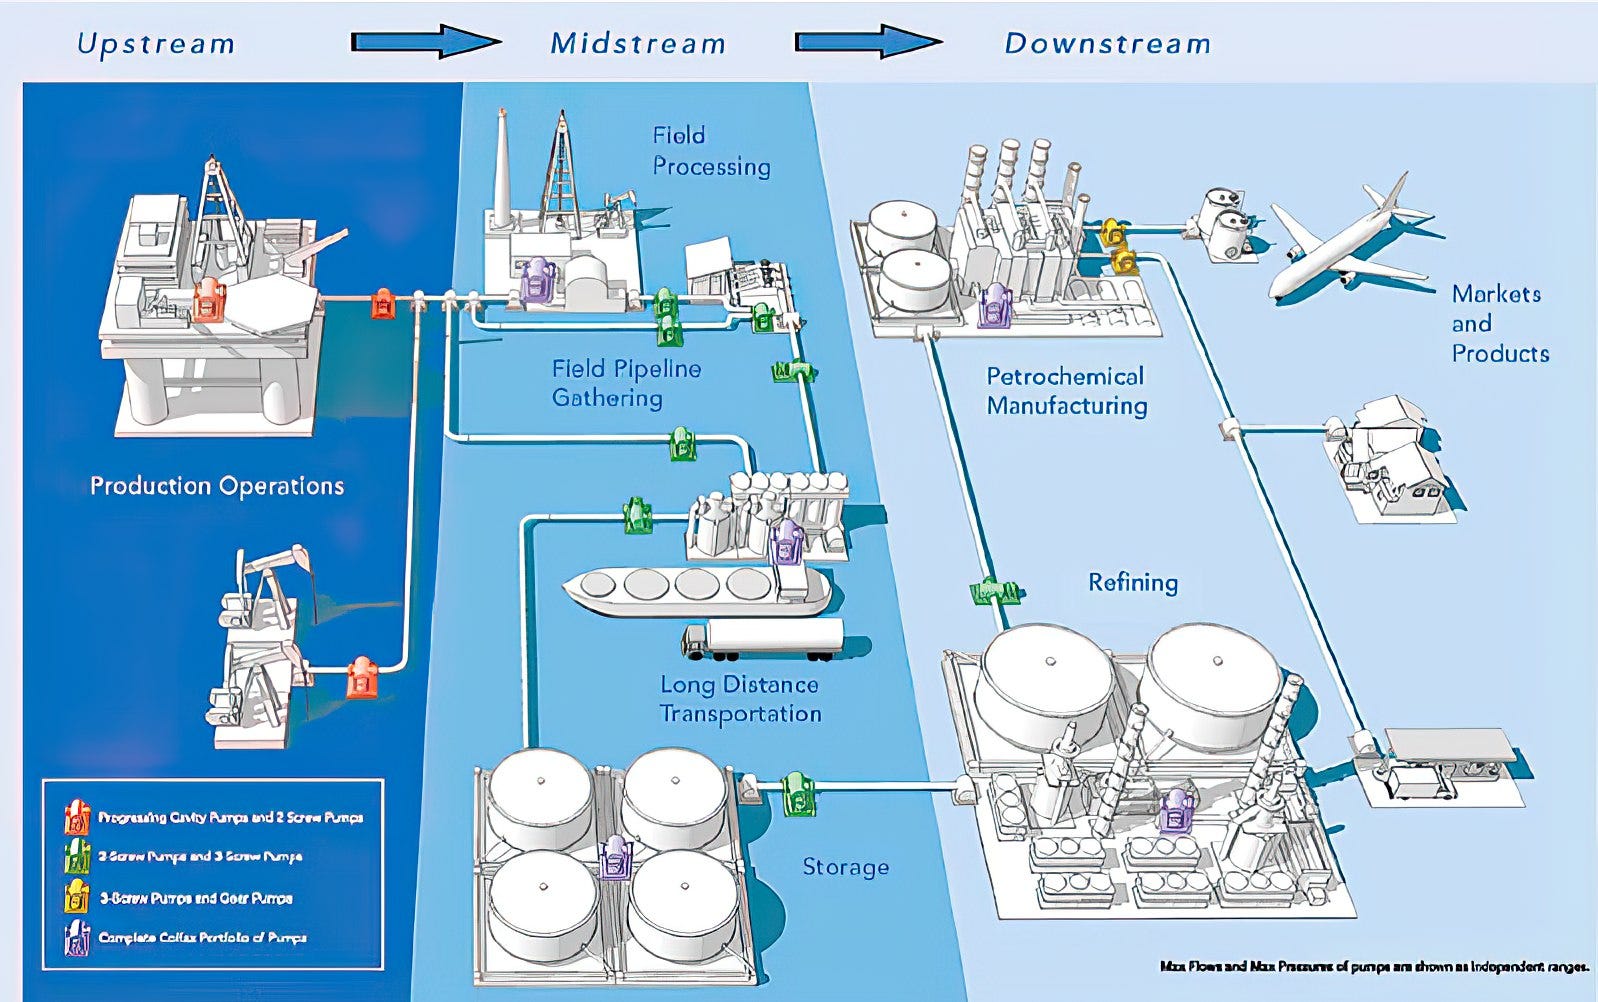
In a broad sense, the energy industry is subdivided into three main sectors: upstream, midstream, and downstream. Upstream is primarily concerned with the exploration and extraction of crude oil; midstream involves transportation and storage; while downstream refers to the refining, marketing, and distribution of these petroleum-based products.
Focusing on Valero, we find a company that operates almost exclusively in the downstream market. The essence of the downstream business model is quite simple: refineries purchase crude, process it into various products like diesel, gasoline, and jet fuel, and then sell them on. Profitability is largely derived from the margin between the input cost and output price, which on the industry level is called the “crack spread” (more on this later). This margin reflects processing fees and operational costs, as well as market demand for refined products. Essentially, the success of a company like Valero hinges on its ability to efficiently convert crude into higher-value products and adapt to the fluctuations in both input costs and product prices.
Valero owns and operates 13 petroleum refineries in the U.S. (mostly in the Gulf Coast and California), one in Canada, and one in the United Kingdom. Crude oil and other “feedstock” (similar raw materials like natural gas or naphtha) are bought at market “spot” prices. It also owns pipelines, terminals, tanks, marine docks, among other logistical assets, to transport their products and sell them across the U.S., Canada, U.K., Latin America, and around the world.
In addition, the company operates two low-carbon refinery segments: Renewable Diesel (RD) and Ethanol, which make up, on average, about 10% and 5% of operating profit respectively, so they are not large parts of the overall business. We will not overly concern ourselves with these segments as they are far too complex to model, being subject to a regulatory framework set by the EPA. As such, demand for them exists primarily because of government minimum quotas, supported by tax credits and various state subsidies. Suffice it to say that Valero has been investing in these low-carbon technologies with a view to diversify its business: in January 2023 it approved a $315 million project that will make it one of the largest producers of Sustainable Aviation Fuel (SAF) in the world by 2025. It also announced a large-scale carbon capture and sequestration pipeline system.
Nonetheless, there has also been talk of a potential collapse in the credit prices in these low-carbon markets, which is a material risk for Valero.1
Cracking up
A wide range of ever-changing economic and other forces — domestic and international — are constantly impacting the crack spread and contributing to its volatility. For simplicity, let’s break down these factors into four subcategories:
1. Crude oil supply is affected by production quotas from major oil-producing countries like OPEC+, record production in the US, political stability in oil-rich regions, war, sanctions, hurricanes or other natural disasters, and by government mandates to transition to lower-carbon energy sources.
2. Crude oil demand is driven primarily by economic growth in major economies.
3. Refining supply is influenced by capacity utilization and maintenance, improvements in refining technology, and regulatory changes.
4. Refining demand for products like gasoline, diesel, and jet fuel varies with consumer behavior and transportation trends, which can be seasonal, cyclical, or secular.


In 2020, global demand cratered while people stayed home and refineries everywhere shut down or had their operations curtailed. 2021 and 2022 saw a resurgence in fuel demand that, coupled with the aforementioned decrease in capacity, significantly tightened global supplies. This led to the highest refining margins observed in years, as can be seen in the charts above.
This changed in 2023, when more new capacity was added than in any other recent period. This increase was primarily located in the Middle East and Asia, with notable additions in the U.S. as well, including an expansion by Exxon in Texas2. As a result, the global market shifted from a shortage to a slight surplus of refining capacity. This then caused the crack spread to plummet, though it remains strong and around its long-term average.
Looking Ahead
As we can see, trying to value commodity businesses presents a unique challenge in that often their performance hinges less on intrinsic qualities of the company itself than on the unpredictable movement of external macro factors. And the task of trying to forecast those factors seems daunting and probably futile. Will consensus figures for EV adoption prove too optimistic? Will work-from-home practices cause people to drive less? Will global refinery capacity contract? Will war in the Middle East break out? Will the shale boom drive the US to keep increasing its market share? What effect would a stronger or weaker dollar have on margins? etc.
Volatility, in short, is the nature of the business.
It may be more pragmatic instead to focus narrowly on the performance of this company as it pertains to its intended purpose in our portfolio. By thinking about it as a defensive play against either supply-side shocks or a prolonged inflationary period fueled by a robust consumer, we align our strategy more closely with specific risk management objectives, rather than getting lost in the broader and highly speculative task of attempting to accurately nail down market-wide trends.
Nevertheless, we proceed with our model. Though we recognize our own limitations in forecasting the future, it is helpful to understand what assumptions the market is pricing in now.
Normalize, Normalize, Normalize
If earnings and cash flows in the current year are, for the most part, a function of where we are in the commodity cycle, we cannot therefore use a single point in time to extrapolate into the future, without trying to normalize for—or smooth out—the ups and downs that will inevitably come.
With a mature, integrated energy company like Exxon it might suffice to come up with a normalized price for oil and then multiplying that by units sold to get to revenues and, after some reasonable assumptions about cost, earnings. But Valero, being smaller and in the downstream market, requires a more nuanced approach.
One way to normalize operating income would be to take the average over a period that captures one or two business cycles — say, between 2007 and 2022.

While the benefit of this approach lies in its simplicity, it probably ends up underestimating the current earnings potential since the average necessarily includes years when the company was smaller. Another method would be to take the average historical operating margin and applying that to an average of the current revenue cycle (we used 2020, 2021, and 2022 revenue averages). The results of both approaches, as seen in the table above, are fairly similar.
Normalized Revenues = (171,189 + 108,332 + 60,115) / 3 = 113,2123
Normalized EBIT = 3.9% x 113,212 = 4,398
For 2023 we used consensus estimated figures, since most of that has been reported already: 146,183 for revenues and 11,799 EBIT. In comparison, JPM estimates for 2023 are 149,013 revenues and 11,601 EBIT.
For 2024 we used negative 10% revenue growth to account for a possible near-term slowdown: 131,565 for revenues and 5,262 EBIT. In comparison, JPM estimates for 2024 are higher at 153,289 revenues and 6,930 EBIT.
Beyond that, we used our normalized figures above with a 2% CAGR. JPM provides estimates only until 2025: 144,272 for revenues and 6,584 EBIT.


Other Assumptions
To get from Operating Income to equity value we made the following assumptions.
We used an industry (bottom-up) beta of 0.84 and then used the 10-year bond rate of 4.1% and an Equity Risk Premium of 4.6%5 to calculate a levered beta of 0.92 and, with that, the cost of equity:
Cost of Equity = 4.1% + (0.92 * 4.6%) = 8.35%
As of Sept 2023, on a LTM basis, Valero has 11,441 in debt outstanding (including capitalized lease obligations) and a market cap of 43,149, resulting in a debt ratio of 16.52%. Average maturity of its bonds was ~12 years and we used the interest on a similarly-dated bond listed on its 10K6 at 7% as the pre-tax cost of debt. Using an effective tax rate of 22% we arrive at:
Cost of Debt = 7% * (1 - 22%) = 5.43%
We used a CAGR of 2%, which is slightly below the company’s historical average of 2.2%, in perpetuity (more on this below).
To quantify the reinvestment needed to sustain that growth, we used a sales-to-capital ratio of 3.6, which is the average since 2017. We chose this starting point (rather than 2007) as it was the year Valero began capitalizing its lease obligations.
Sales-to-Capital Ratio = Sales / Capital Employed
If the denominator is smaller because it excludes lease liabilities as debt on its balance sheet, the result can lead to an artificially higher ratio. Indeed, the average ratio from 2007 excluding capitalized leases is 4.3.
Terminal Value
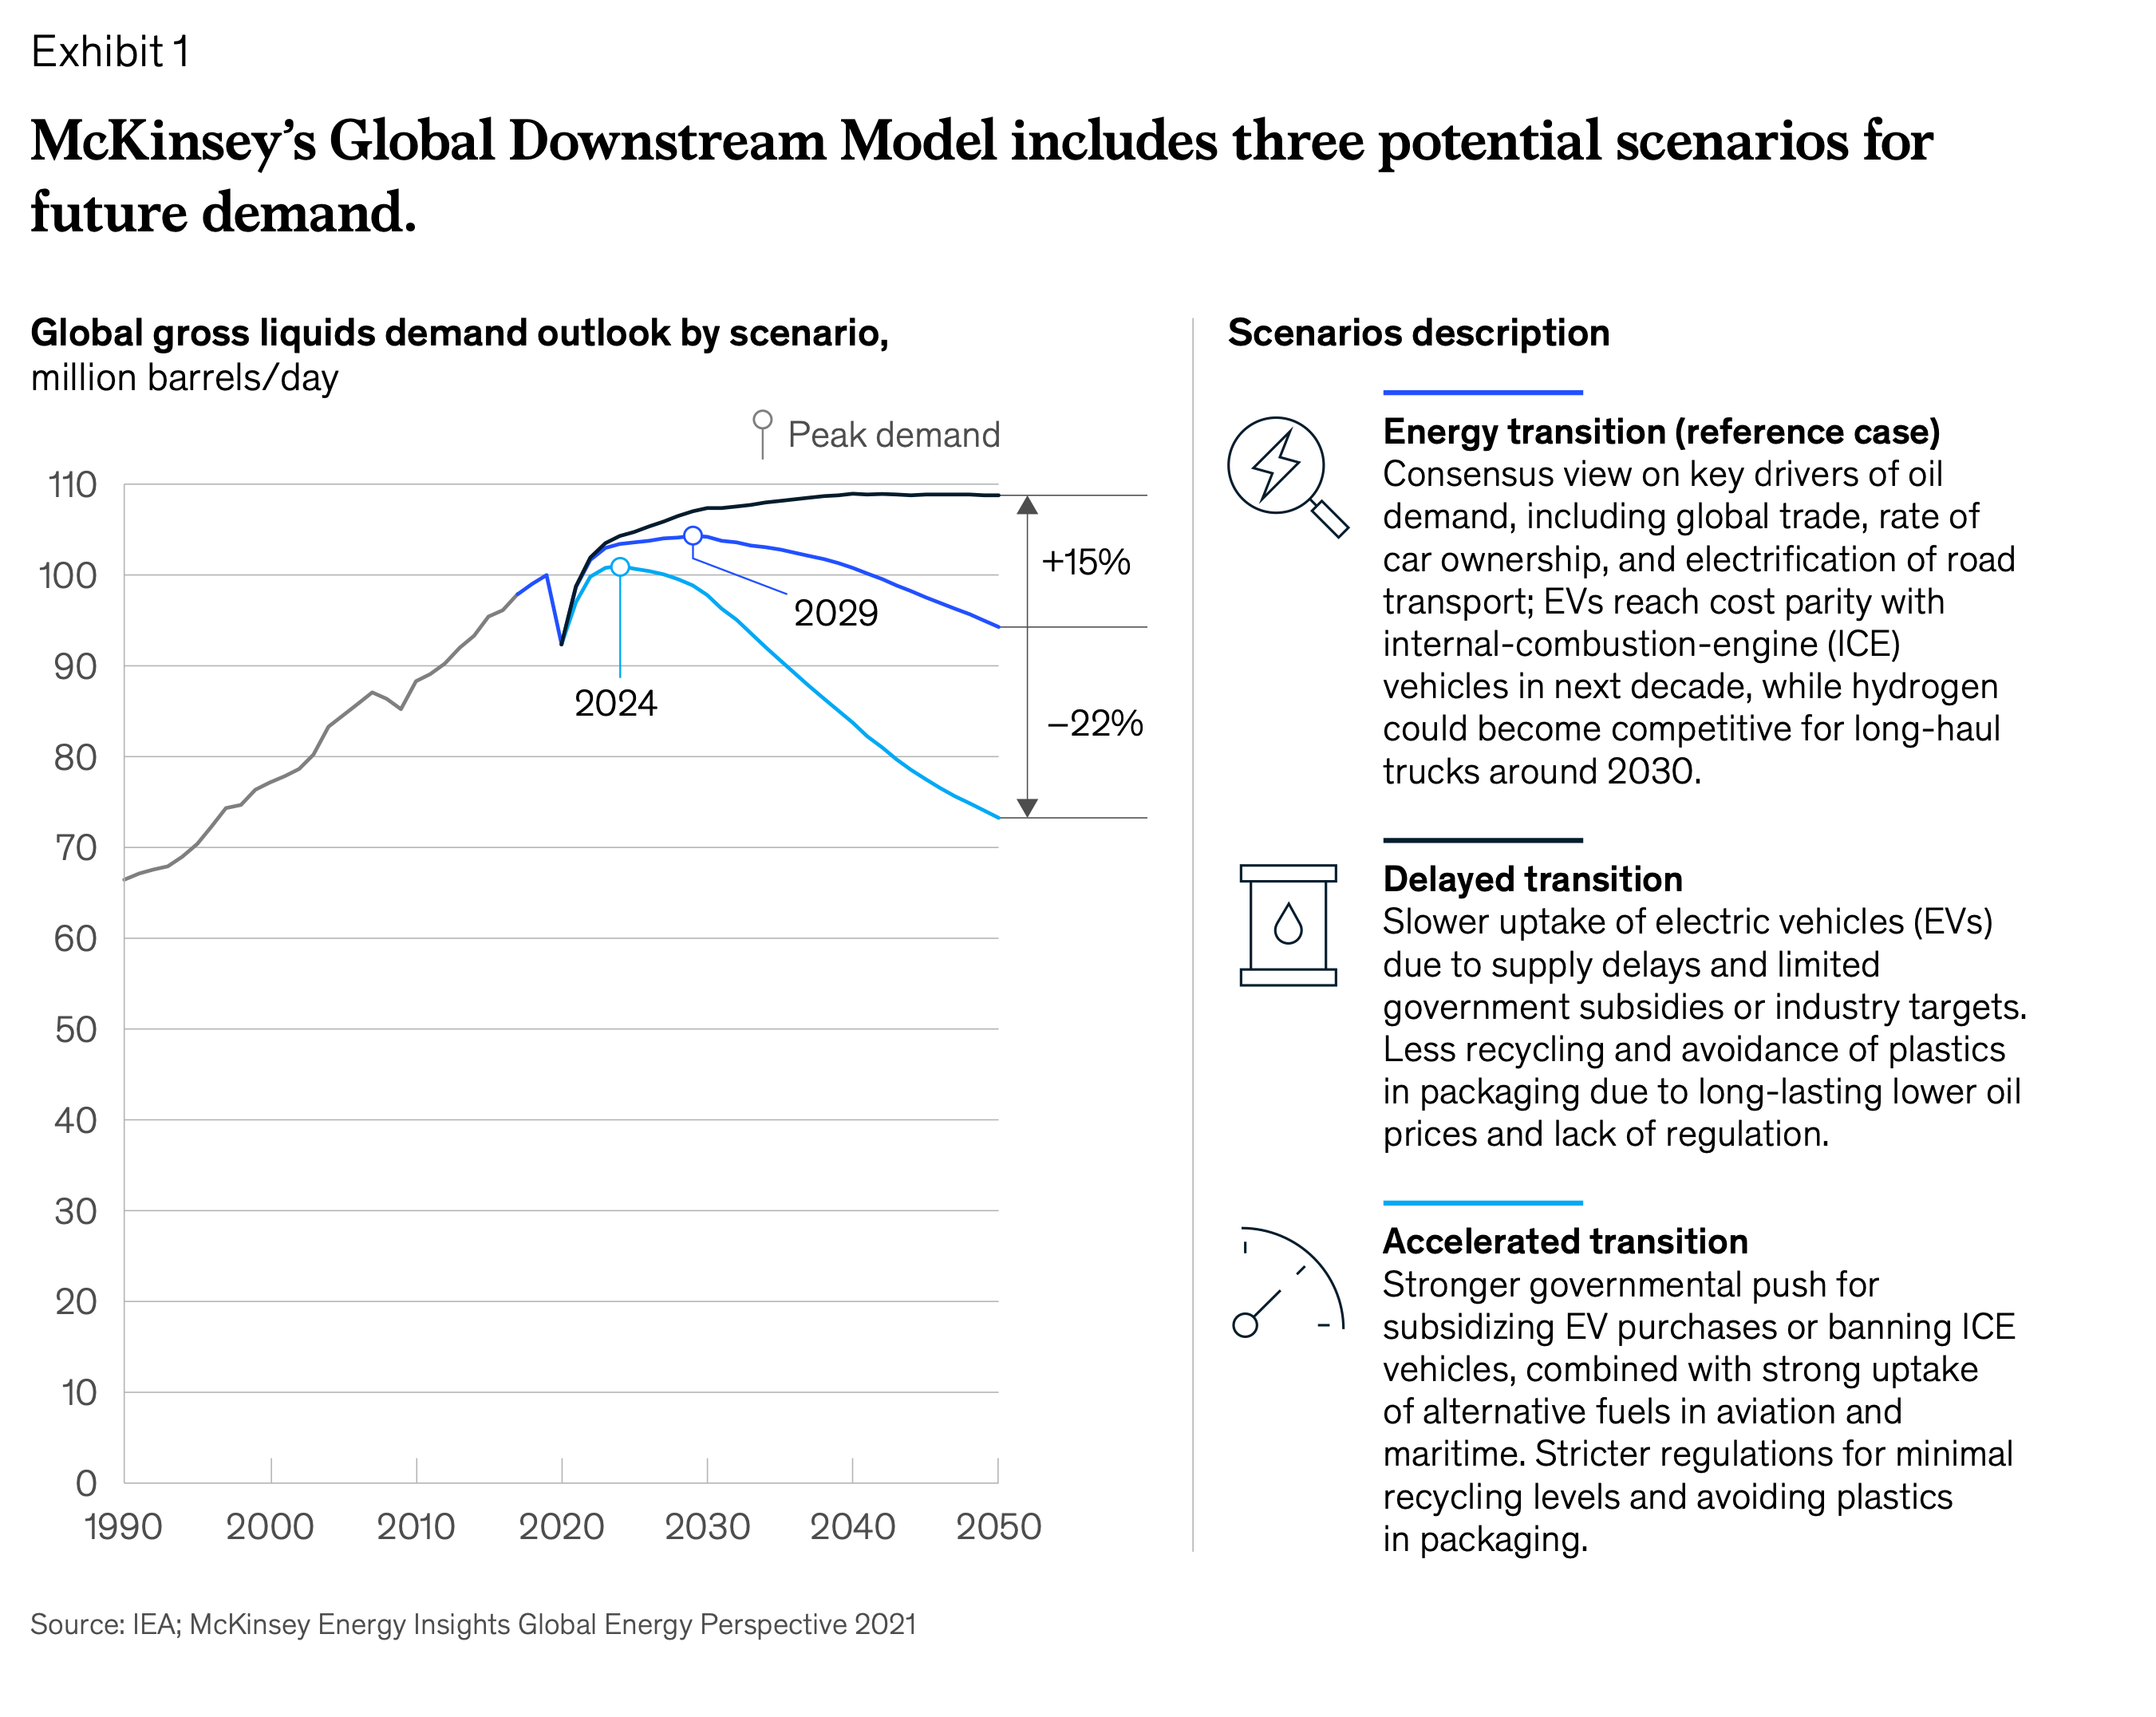
Here’s a tricky one: terminal value. At some point in the future one of two things need to happen: either the world will willingly transition away from carbon-based energy sources; or if not, then that resource, being finite, will run out (and the transition will happen anyway, just more abruptly). Either way, there should be some adjustment to the usual practice of assuming perpetual growth. The difficulty lies in estimating how much to adjust with any degree of confidence: when will we reach peak oil?
Based on the assumptions outlined in the preceding section, the present value of the company's cash flows for the upcoming decade is calculated to be 21,417. If we consider the company as a going concern in perpetuity, the present value of its terminal value is determined to be 33,510. Notably, then, this terminal value represents about 60% of the company's total present value.
Next, we adjusted the terminal value downward to match the estimated price per share with the current market price, at $126. This adjustment revealed that the terminal value needs to be approximately 13% lower than its calculated "in perpetuity" value to achieve this alignment.
As investors, we believe this provides us with a decent, though not amazing, long-term buffer. It should also be pointed out that all of our assumptions were quite conservative, and that JPM’s price target is significantly above ours, at $176.

Conclusion
The sheer number of people on this planet is staggering, with 7 billion currently consuming only 3 barrels of oil per capita annually compared to the 13-14 barrels consumed by the more fortunate of us who live in the developed world. Recognizing this massive worldwide need for energy is not an endorsement of any particular view on what should happen, but rather what likely will happen, and it seems fairly safe to assume that given the escalating geopolitical tension, countries are less likely to care about where they actually get this energy from—so long as they get it.
We hope, and do believe, that the world will place a heavier emphasis on developing renewable and low-carbon options—solar, wind, geothermal, nuclear, renewable diesel, SAF, among others—but no doubt pragmatism and self-determination will also drive nations to cling to traditional sources of energy for a long time to come. Valero, for its part, has been involved in alternate fuels since its acquisition in 2009 of biofuels producer VeraSun and is particularly well positioned to grow in this area—something we barely touched on. This is because we wanted to value Valero without any overly optimistic assumptions about the future, and leave that as potential upside.
We like Valero, and it fits nicely with our desire to reduce inflation risk in our portfolio from both supply- or demand-side. As with any energy company, it is volatile. A recession tomorrow could spell trouble for the stock. But the recent pull-back provides a decent entry point, and any further downturn allows us to increase our position.
https://rbnenergy.com/baby-the-rins-must-fall-a-decade-after-the-big-bang-are-rin-prices-headed-for-a-crash
https://rbnenergy.com/fuel-rollercoaster-anticipating-the-twists-and-turns-ahead-in-us-and-global-product-markets
All figures reported in millions
Though Damodaran does not provide a specific unlevered beta for downstream energy companies, looking at the peer group provides some indication of where beta might be:
https://pages.stern.nyu.edu/~adamodar/New_Home_Page/datafile/Betas.html
https://pages.stern.nyu.edu/~adamodar/New_Home_Page/datafile/ctryprem.html
Page 93 in the latest 10K:
https://d18rn0p25nwr6d.cloudfront.net/CIK-0001035002/b8d4c6a6-7d8b-4bce-945d-e2a865f03e38.pdf